
K Visa Timeline Statistics
The Statistics Below reflect applications filed within the last 60 days.Select the History Period: [ ALL Time ] [ Last Year ] [ Last 6 months ] [ Last 3 months ]
Overall Statistics by Visa Type (for the last 60 days)
| Visa Type | Total Records | Avg. Total Days to Interview | Avg. Days to I-129f 1st NOA | Avg. Days btw 1st I-129F NOA and 2nd I-129F NOA | Avg. Days between I-129F NOA2 and Consulate Receiving (NVC Processing Phase) | Avg. Days between Consulate Receiving Information from NVC and Actual Interview |
|---|---|---|---|---|---|---|
| K1 | 88 | 407 | 5 | 232 | 101 | 69 |
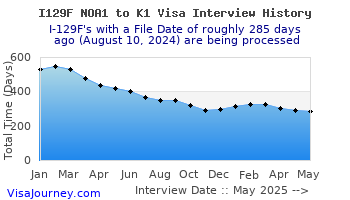
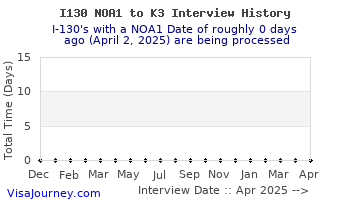
Historical K1 and K3 Processing Times (Initial Document Filing Date --> Interview):
I-129f Service Center Statistics (for the last 60 days)
| Service Center | Total Records | Avg. Total Days to Approval | Avg. Days to I-129f 1st NOA | Avg. Days btw 1st I-129F NOA and 2nd I-129F NOA |
|---|---|---|---|---|
| Texas Service Center | 6 | 245 | 5 | 240 |
| California Service Center | 34 | 288 | 4 | 283 |
| Service Center | Total Records | Avg. Total Days to Approval | Avg. Days to I-129f 1st NOA | Avg. Days btw 1st I-129F NOA and 2nd I-129F NOA |
|---|---|---|---|---|
| National Benefits Center |
Statistics by Country, Visa Type (for the last 60 days)
| Beneficiary's Country | Visa Type | Total Records | Num of Pending Applications | Num with Final Visa Approval | Avg. Days between Consulate Receiving Information from NVC and Actual Interview |
|---|---|---|---|---|---|
| Finland | K1 | 1 | 1 | 0 | 326 |
| France | K1 | 2 | 2 | 0 | 58 |
| Morocco | K1 | 3 | 3 | 0 | 99 |
| United Kingdom | K1 | 9 | 7 | 2 | 66 |
| Colombia | K1 | 2 | 0 | 2 | 37 |
| Taiwan | K1 | 2 | 2 | 0 | 56 |
| Brazil | K1 | 7 | 4 | 3 | 85 |
| Japan | K1 | 3 | 2 | 1 | 90 |
| Philippines | K1 | 10 | 9 | 1 | 64 |
| Kenya | K1 | 2 | 2 | 0 | 63 |
| Portugal | K1 | 2 | 0 | 2 | 61 |
| Turkey | K1 | 3 | 3 | 0 | 36 |
| India | K1 | 3 | 3 | 0 | 32 |
| Canada | K1 | 7 | 5 | 2 | 83 |
| Indonesia | K1 | 2 | 1 | 1 | 68 |
| Cambodia | K1 | 1 | 1 | 0 | 83 |
| Thailand | K1 | 4 | 2 | 2 | 53 |
| South Korea | K1 | 2 | 2 | 0 | 29 |
| Germany | K1 | 4 | 2 | 2 | 45 |
| Spain | K1 | 1 | 1 | 0 | 47 |
| Jamaica | K1 | 2 | 2 | 0 | 24 |
| Netherlands | K1 | 1 | 0 | 1 | 57 |
| Latvia | K1 | 1 | 1 | 0 | 35 |
| Australia | K1 | 2 | 2 | 0 | 98 |
| Vietnam | K1 | 3 | 3 | 0 | 53 |
| Peru | K1 | 1 | 1 | 0 | 44 |
| China | K1 | 1 | 1 | 0 | 62 |
| New Zealand | K1 | 2 | 0 | 2 | 96 |
| Ukraine | K1 | 1 | 1 | 0 | 18 |
| Greece | K1 | 1 | 0 | 1 | 35 |
| Beneficiary's Country | Visa Type | Total Records | Num of Pending Applications | Num with Final Visa Approval | Avg. Days between Consulate Receiving Information from NVC and Actual Interview |
| Ireland | K1 | 1 | 1 | 0 | 115 |
| Argentina | K1 | 1 | 0 | 1 | 132 |
| Namibia | K1 | 1 | 1 | 0 |
Statistics by Consulate, Visa Type (for the last 60 days)
| Consulate | Visa Type | Total Records | Num of Pending Applications | Num with Final Visa Approval | Avg. Days between Consulate Receiving Information from NVC and Actual Interview |
|---|---|---|---|---|---|
| Sweden | K1 | 2 | 2 | 0 | 181 |
| France | K1 | 4 | 2 | 2 | 60 |
| Morocco | K1 | 3 | 3 | 0 | 99 |
| London, United Kingdom | K1 | 9 | 7 | 2 | 66 |
| Bogota, Colombia | K1 | 2 | 0 | 2 | 37 |
| Taipei, Taiwan | K1 | 2 | 2 | 0 | 56 |
| Rio de Janeiro, Brazil | K1 | 6 | 3 | 3 | 86 |
| Tokyo, Japan | K1 | 4 | 3 | 1 | 87 |
| Singapore | K1 | 1 | 1 | 0 | |
| Kenya | K1 | 2 | 2 | 0 | 63 |
| Cambodia | K1 | 2 | 2 | 0 | 55 |
| Manila, Philippines | K1 | 8 | 7 | 1 | 69 |
| Ankara, Turkey | K1 | 3 | 3 | 0 | 36 |
| Mumbai, India | K1 | 3 | 3 | 0 | 32 |
| Montreal, Canada | K1 | 4 | 2 | 2 | 99 |
| Indonesia | K1 | 2 | 1 | 1 | 68 |
| Bangkok, Thailand | K1 | 4 | 2 | 2 | 53 |
| Seoul | K1 | 2 | 2 | 0 | 29 |
| Frankfurt, Germany | K1 | 5 | 2 | 3 | 49 |
| Madrid, Spain | K1 | 1 | 1 | 0 | 47 |
| Jamaica | K1 | 2 | 2 | 0 | 24 |
| Sydney, Australia | K1 | 2 | 2 | 0 | 98 |
| Ho Chi Minh City, Vietnam | K1 | 3 | 3 | 0 | 53 |
| Ottowa, Canada | K1 | 1 | 1 | 0 | 87 |
| Peru | K1 | 1 | 1 | 0 | 44 |
| Guangzhou, China | K1 | 1 | 1 | 0 | 62 |
| Auckland, New Zealand | K1 | 2 | 0 | 2 | 96 |
| Warsaw, Poland | K1 | 1 | 1 | 0 | 18 |
| Athens, Greece | K1 | 1 | 0 | 1 | 35 |
| Naples, Italy | K1 | 1 | 1 | 0 | 33 |
| Consulate | Visa Type | Total Records | Num of Pending Applications | Num with Final Visa Approval | Avg. Days between Consulate Receiving Information from NVC and Actual Interview |
| Armenia | K1 | 1 | 1 | 0 | 66 |
| Dublin, Ireland | K1 | 1 | 1 | 0 | 115 |
| Argentina | K1 | 1 | 0 | 1 | 132 |
| South Africa | K1 | 1 | 1 | 0 |
Pending - Visa not yet received/ not in hand
Back to Timelines
 ver 5.0