
AP Timelines Statistics
The Statistics Below reflect applications filed within the last 180 days.Select the History Period: [ ALL Time ] [ Last Year ] [ Last 6 months ] [ Last 3 months ]
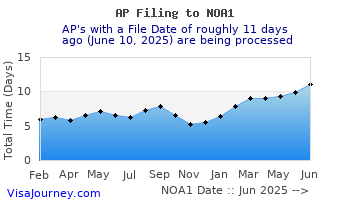
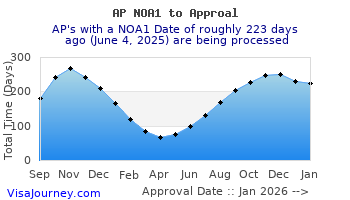
Overall Statistics (for last 180 days)
| Total Records | Avg. Total Days | Avg. Days to 1st NOA | Avg. Days btw NOA and Approval |
|---|---|---|---|
| 3 | 189 | 11 | 178 |
Back to Timelines
 ver 5.0