
CR-1 / IR -1 Visa Timeline Statistics
The Statistics Below reflect applications filed within the last 90 days.Select the History Period: [ ALL Time ] [ Last Year ] [ Last 6 months ] [ Last 3 months ]
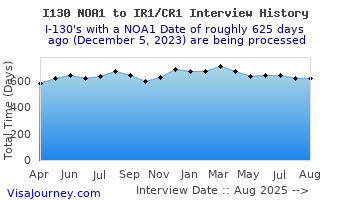
Overall Interview Statistics (for last 90 days)
| Total Records | Avg. Total Days to Interview | Avg. Days to I-130 NOA1 | Avg. Days btw NOA1 and NOA2 | Avg. Days btw NOA2 and Interview |
|---|---|---|---|---|
| 28 | 625 | >5 | 463 | 216 |
Service Center Statistics (I-130 files completed in the last 90 days)
| Service Center | Total Records | Avg. Total Days to Approval | Avg. Days to I-130 NOA1 | Avg. Days btw NOA1 and NOA2 |
|---|---|---|---|---|
| Nebraska Service Center | 11 | 391 | 0 | 391 |
| Texas Service Center | 16 | 426 | 2 | 425 |
| Vermont Service Center | 6 | 396 | 2 | 394 |
| California Service Center | 3 | 420 | 1 | 419 |
| National Benefits Center | 1 | 383 | 6 | 377 |
Country Statistics (for last 90 days)
| Beneficiary's Country | Total Records | Num of Pending Applications | Num with Final Visa Approval | Avg. Days btw NOA2 and Interview |
|---|---|---|---|---|
| Kenya | 1 | 1 | 0 | 862 |
| Canada | 7 | 2 | 5 | 150 |
| Philippines | 2 | 2 | 0 | 238 |
| Nigeria | 1 | 0 | 1 | 555 |
| Pakistan | 1 | 1 | 0 | 325 |
| Peru | 2 | 1 | 1 | 139 |
| United Kingdom | 3 | 2 | 1 | 196 |
| Morocco | 1 | 1 | 0 | 168 |
| Vietnam | 1 | 1 | 0 | 138 |
| Iran | 1 | 0 | 1 | 321 |
| Brazil | 2 | 2 | 0 | 121 |
| Chile | 1 | 0 | 1 | 82 |
| Costa Rica | 1 | 1 | 0 | 96 |
| Barbados | 1 | 1 | 0 | 214 |
| Singapore | 1 | 0 | 1 | 121 |
| United Arab Emirates | 1 | 1 | 0 | 387 |
| Dominican Republic | 1 | 1 | 0 | 130 |
Status By Consulate, Visa Type (statistics for last 90 days)
| Consulate | Total Records | Num of Pending Applications | Num with Final Visa Approval | Avg. Days btw NOA2 and Interview |
|---|---|---|---|---|
| Kenya | 1 | 1 | 0 | 862 |
| Montreal, Canada | 7 | 2 | 5 | 150 |
| Manila, Philippines | 2 | 2 | 0 | 238 |
| Nigeria | 1 | 0 | 1 | 555 |
| Islamabad, Pakistan | 1 | 1 | 0 | 325 |
| Peru | 1 | 1 | 0 | 147 |
| London, United Kingdom | 3 | 2 | 1 | 196 |
| Tokyo, Japan | 1 | 0 | 1 | 131 |
| Morocco | 1 | 1 | 0 | 168 |
| Ho Chi Minh City, Vietnam | 1 | 1 | 0 | 138 |
| Ankara, Turkey | 1 | 0 | 1 | 321 |
| Rio de Janeiro, Brazil | 2 | 2 | 0 | 121 |
| Chile | 1 | 0 | 1 | 82 |
| Costa Rica | 1 | 1 | 0 | 96 |
| Barbados | 1 | 1 | 0 | 214 |
| Singapore | 1 | 0 | 1 | 121 |
| United Arab Emirates | 1 | 1 | 0 | 387 |
| Dominican Republic | 1 | 1 | 0 | 130 |
Pending - Visa not yet received/ not in hand
Timelines
 ver 5.0