
K Visa Timeline Statistics
The Statistics Below reflect applications filed within the last -90 days.Select the History Period: [ ALL Time ] [ Last Year ] [ Last 6 months ] [ Last 3 months ]
Overall Statistics by Visa Type (for the last -90 days)
| Visa Type | Total Records | Avg. Total Days to Interview | Avg. Days to I-129f 1st NOA | Avg. Days btw 1st I-129F NOA and 2nd I-129F NOA | Avg. Days between I-129F NOA2 and Consulate Receiving (NVC Processing Phase) | Avg. Days between Consulate Receiving Information from NVC and Actual Interview |
|---|---|---|---|---|---|---|
| K1 | 1 | 8 | 229 | 79 | 131 |
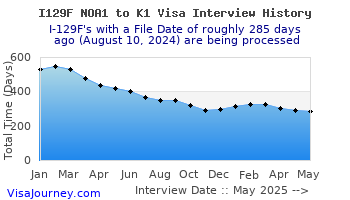
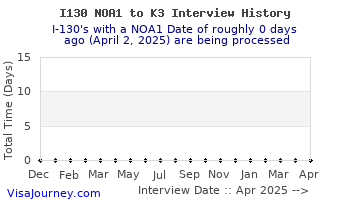
Historical K1 and K3 Processing Times (Initial Document Filing Date --> Interview):
I-129f Service Center Statistics (for the last -90 days)
| Service Center | Total Records | Avg. Total Days to Approval | Avg. Days to I-129f 1st NOA | Avg. Days btw 1st I-129F NOA and 2nd I-129F NOA |
|---|
| Service Center | Total Records | Avg. Total Days to Approval | Avg. Days to I-129f 1st NOA | Avg. Days btw 1st I-129F NOA and 2nd I-129F NOA |
|---|---|---|---|---|
| National Benefits Center |
Statistics by Country, Visa Type (for the last -90 days)
| Beneficiary's Country | Visa Type | Total Records | Num of Pending Applications | Num with Final Visa Approval | Avg. Days between Consulate Receiving Information from NVC and Actual Interview |
|---|---|---|---|---|---|
| Brazil | K1 | 1 | 1 | 0 | 131 |
Statistics by Consulate, Visa Type (for the last -90 days)
| Consulate | Visa Type | Total Records | Num of Pending Applications | Num with Final Visa Approval | Avg. Days between Consulate Receiving Information from NVC and Actual Interview |
|---|---|---|---|---|---|
| Rio de Janeiro, Brazil | K1 | 1 | 1 | 0 | 131 |
Pending - Visa not yet received/ not in hand
Back to Timelines
 ver 5.0