
AOS Timelines Statistics
The Statistics Below reflect applications filed within the last 180 days.Select the History Period: [ ALL Time ] [ Last Year ] [ Last 6 months ] [ Last 3 months ]
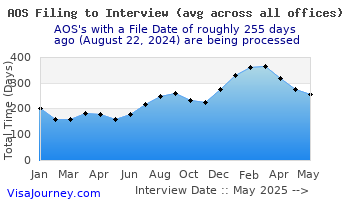
Overall AOS Statistics (for the last 180 days)
| Total Records | Avg. Total Days to Interview | Avg. Days to 1st NOA | Avg. Days btw 1st NOA Biometrics | Avg. Days btw Biometrics and Interview (if interview required) | Avg. Days btw Biometrics and Decision Date | Avg. Days btw Decision Date and Receiving Green Card |
|---|---|---|---|---|---|---|
| 62 | 155 | 7 | 24 | 125 | 131 | 12 |
Statistics by AOS Office (for the last 180 days)
| AOS Office | Total Records | Avg. Total Days to Interview | Avg. Days to 1st NOA | Avg. Days btw 1st NOA Biometrics | Avg. Days btw Biometrics and Interview (if interview required) | Avg. Days btw Biometrics and Decision Date | Avg. Days btw Decision Date and Receiving Green Card |
|---|---|---|---|---|---|---|---|
| Chicago IL | 5 | 131 | 11 | 21 | 100 | 120 | 8 |
| Jacksonville FL | 1 | 410 | 19 | 24 | 367 | 367 | |
| Washington DC | 1 | 81 | 4 | 7 | 70 | 71 | |
| Tampa FL | 4 | 335 | 5 | 27 | 304 | 223 | 9 |
| Montgomery AL | 3 | 299 | 17 | 27 | 255 | 258 | 16 |
| Indianapolis IN | 1 | 194 | 4 | 23 | 167 | 168 | 8 |
| Portland ME | 1 | 71 | 3 | 21 | 47 | 47 | 11 |
| Hartford CT | 1 | 155 | 7 | 23 | 125 | ||
| Dallas TX | 5 | 90 | 4 | 23 | 63 | 109 | 6 |
| Atlanta GA | 2 | 212 | 7 | 17 | 313 | 318 | 22 |
| Phoenix AZ | 2 | 161 | 8 | 32 | 125 | 125 | 7 |
| Reno NV | 1 | 95 | 2 | 24 | 69 | ||
| Columbus OH | 1 | 105 | 4 | 25 | 76 | 77 | 13 |
| Saint Paul MN | 2 | 91 | 3 | 27 | 62 | ||
| Norfolk VA | 1 | 107 | 7 | 21 | 79 | 85 | 15 |
| Syracuse NY | 1 | 158 | 15 | 20 | 123 | 135 | 11 |
| Salt Lake City UT | 2 | 348 | 12 | 21 | 316 | ||
| San Jose CA | 1 | 117 | 35 | ||||
| Seattle WA | 3 | 109 | 8 | 32 | 69 | 84 | 10 |
| Nashville TN | 1 | 260 | 7 | 27 | 226 | 227 | |
| Helena MT | 1 | 108 | 5 | 41 | 62 | ||
| Philadelphia PA | 4 | 120 | 7 | 26 | 86 | 102 | 13 |
| Saint Louis MO | 1 | 92 | 6 | 22 | 64 | 65 | 13 |
| Manchester NH | 1 | 169 | 5 | 25 | 139 | 140 | 13 |
| Albany NY | 1 | 80 | 36 | -9 | 53 | 53 | |
| Detroit MI | 1 | 76 | 7 | 23 | 46 | ||
| Boston MA | 2 | 91 | 3 | 31 | 57 | 58 | 13 |
| Fresno CA | 1 | 187 | 5 | 23 | 159 | 160 | |
| Denver CO | 1 | 110 | 2 | 23 | 85 | 106 | 9 |
| West Palm Beach FL | 1 | 95 | 4 | 19 | 72 | ||
| AOS Office | Total Records | Avg. Total Days to Interview | Avg. Days to 1st NOA | Avg. Days btw 1st NOA Biometrics | Avg. Days btw Biometrics and Interview (if interview required) | Avg. Days btw Biometrics and Decision Date | Avg. Days btw Decision Date and Receiving Green Card |
| Cincinnati OH | 1 | 95 | 2 | 23 | 70 | 71 | 16 |
| Milwaukee WI | 1 | 44 | 4 | 18 | 22 | 81 | |
| Raleigh NC | 1 | 66 | 3 | 26 | 37 | 45 | 12 |
| Tucson AZ | 1 | 61 | 8 | 17 | 36 | 64 | 18 |
| Orlando FL | 2 | 134 | 5 | 19 | 111 | 111 | 13 |
| Pittsburgh PA | 1 | 171 | 2 | 27 | 142 | ||
| Kansas City MO | 1 | 83 | 3 | 23 | 57 | ||
| Charlotte NC | 1 | 213 | 11 | 23 | 179 |
Back to Timelines
 ver 5.0