
The following graphs indicate the historical processing times for various key steps along the way to obtaining a IR1/CR1 Visa. This is useful so you can judge historic and current trends in processing times. The x-axis of the graphs indicates the date for the data with the most recent dates being on the far right (the far left is the oldest dates). The y-axis represents the actual processing time for that historical period.
> The statistics below are generated from the member supported timeline section and reflect actual data provided by members just like you! Remember to add or update your timeline here.
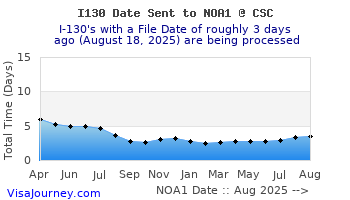
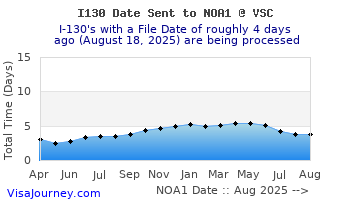
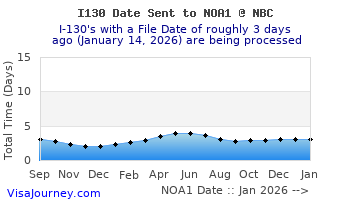
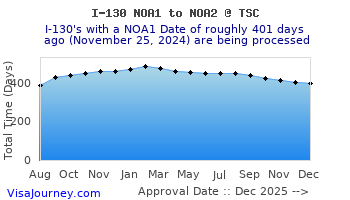
![]() Step 1: I-130 NOA1 Issue Time --> Filing date to I-130 NOA1 Date
Step 1: I-130 NOA1 Issue Time --> Filing date to I-130 NOA1 Date
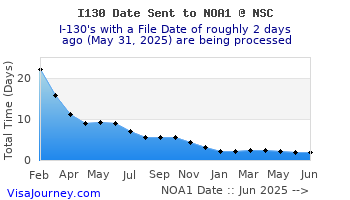
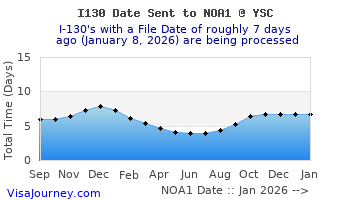
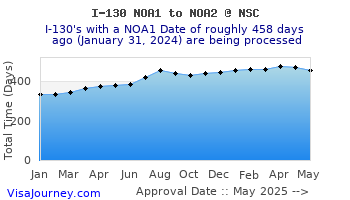
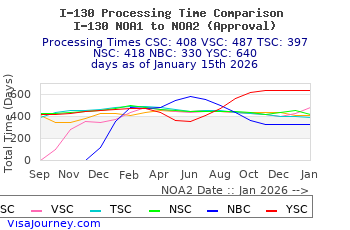
![]() Step 2: I-130 Processing Time at Service Centers (Filing date to I-130 Approval (NOA2)
Step 2: I-130 Processing Time at Service Centers (Filing date to I-130 Approval (NOA2)
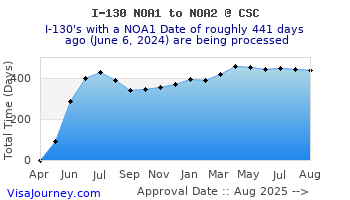
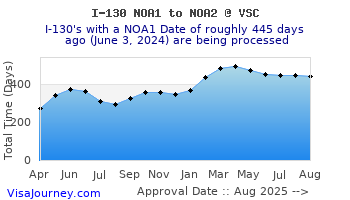
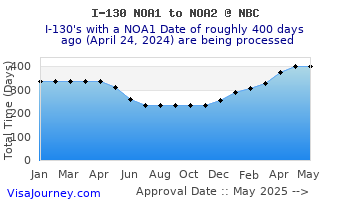

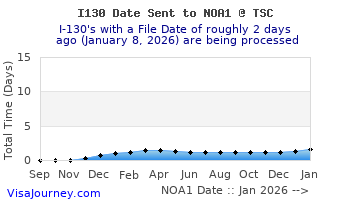
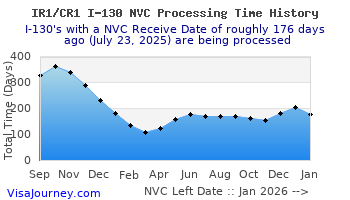
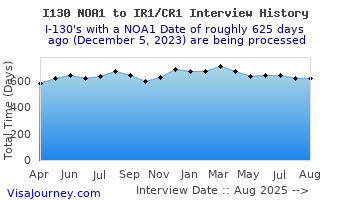
![]() Step 3: I-130 Processing Time at the NVC
Step 3: I-130 Processing Time at the NVC
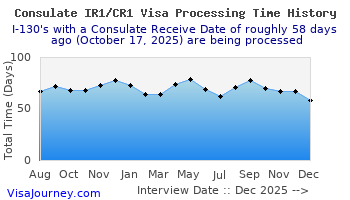
![]() Step 4: Embassy IR1/CR1 Visa Processing Time (receives petition until issues visa)
Step 4: Embassy IR1/CR1 Visa Processing Time (receives petition until issues visa)
NOTE: This is an average of all consulates (see IR1/CR1 stats page for more information)
OVERALL:
![]() For more detailed additional information please the the IR1/CR1 Visa Statistics page.
For more detailed additional information please the the IR1/CR1 Visa Statistics page.