
CR-1 / IR -1 Visa Timeline Statistics
The Statistics Below reflect applications filed within the last 360 days.Select the History Period: [ ALL Time ] [ Last Year ] [ Last 6 months ] [ Last 3 months ]
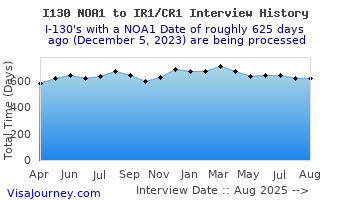
Overall Interview Statistics (for last 360 days)
| Total Records | Avg. Total Days to Interview | Avg. Days to I-130 NOA1 | Avg. Days btw NOA1 and NOA2 | Avg. Days btw NOA2 and Interview |
|---|---|---|---|---|
| 370 | 623 | >4 | 323 | 302 |
Service Center Statistics (I-130 files completed in the last 360 days)
| Service Center | Total Records | Avg. Total Days to Approval | Avg. Days to I-130 NOA1 | Avg. Days btw NOA1 and NOA2 |
|---|---|---|---|---|
| Potomac Service Center | 104 | 343 | 3 | 340 |
| Texas Service Center | 184 | 327 | 3 | 323 |
| California Service Center | 22 | 327 | 4 | 323 |
| Nebraska Service Center | 116 | 334 | 4 | 326 |
| Vermont Service Center | 14 | 349 | 4 | 348 |
| National Benefits Center | 6 | 368 | 3 | 323 |
Country Statistics (for last 360 days)
| Beneficiary's Country | Total Records | Num of Pending Applications | Num with Final Visa Approval | Avg. Days btw NOA2 and Interview |
|---|---|---|---|---|
| Philippines | 19 | 12 | 7 | 273 |
| Canada | 36 | 19 | 17 | 221 |
| Germany | 6 | 3 | 3 | 131 |
| Colombia | 12 | 6 | 6 | 147 |
| Bahrain | 1 | 1 | 0 | 251 |
| Dominican Republic | 12 | 8 | 4 | 332 |
| Malaysia | 2 | 0 | 2 | 110 |
| Mexico | 19 | 11 | 8 | 771 |
| Japan | 6 | 1 | 5 | 123 |
| Ghana | 12 | 3 | 9 | 637 |
| Romania | 3 | 2 | 1 | 149 |
| India | 27 | 13 | 14 | 310 |
| Bulgaria | 1 | 0 | 1 | 167 |
| Liberia | 1 | 0 | 1 | 762 |
| United Kingdom | 27 | 17 | 10 | 137 |
| Cambodia | 1 | 0 | 1 | 328 |
| Gambia | 3 | 1 | 2 | 700 |
| Bangladesh | 5 | 4 | 1 | 288 |
| Lebanon | 3 | 2 | 1 | 284 |
| Peru | 3 | 1 | 2 | 162 |
| Vietnam | 3 | 0 | 3 | 104 |
| Brazil | 7 | 2 | 5 | 198 |
| Nigeria | 20 | 9 | 11 | 523 |
| Uganda | 1 | 1 | 0 | 619 |
| Pakistan | 12 | 7 | 5 | 680 |
| Kenya | 2 | 1 | 1 | 691 |
| Jamaica | 5 | 3 | 2 | 222 |
| Honduras | 6 | 4 | 2 | 511 |
| Costa Rica | 3 | 2 | 1 | 194 |
| Iran | 2 | 2 | 0 | 501 |
| Beneficiary's Country | Total Records | Num of Pending Applications | Num with Final Visa Approval | Avg. Days btw NOA2 and Interview |
| Argentina | 2 | 1 | 1 | 167 |
| Netherlands | 4 | 1 | 3 | 142 |
| Israel | 2 | 2 | 0 | 194 |
| Denmark | 1 | 1 | 0 | 114 |
| Turkey | 6 | 3 | 3 | 201 |
| Australia | 3 | 2 | 1 | 148 |
| Sierra Leone | 1 | 1 | 0 | 113 |
| Morocco | 8 | 5 | 3 | 309 |
| South Korea | 5 | 2 | 3 | 164 |
| Ivory Coast | 1 | 0 | 1 | 235 |
| Belgium | 4 | 3 | 1 | 112 |
| Zambia | 1 | 0 | 1 | 346 |
| Tunisia | 4 | 4 | 0 | 153 |
| New Zealand | 2 | 2 | 0 | 152 |
| Ecuador | 2 | 1 | 1 | 170 |
| Slovakia | 1 | 1 | 0 | 118 |
| Russia | 8 | 5 | 3 | 167 |
| Taiwan | 1 | 0 | 1 | 231 |
| Indonesia | 1 | 0 | 1 | 131 |
| Sweden | 1 | 0 | 1 | 144 |
| France | 5 | 2 | 3 | 149 |
| Yemen, Republic of | 1 | 0 | 1 | 260 |
| Senegal | 1 | 1 | 0 | 275 |
| Singapore | 3 | 1 | 2 | 126 |
| Guyana | 2 | 0 | 2 | 124 |
| Hong Kong | 1 | 0 | 1 | 220 |
| Cameroon | 1 | 0 | 1 | 201 |
| Poland | 1 | 0 | 1 | 242 |
| Grenada | 1 | 1 | 0 | 146 |
| Chile | 3 | 0 | 3 | 162 |
| Beneficiary's Country | Total Records | Num of Pending Applications | Num with Final Visa Approval | Avg. Days btw NOA2 and Interview |
| Finland | 1 | 1 | 0 | 75 |
| Bolivia | 1 | 1 | 0 | 205 |
| Armenia | 1 | 1 | 0 | 112 |
| Haiti | 2 | 2 | 0 | 741 |
| Ethiopia | 1 | 1 | 0 | 793 |
| Somalia | 1 | 1 | 0 | 797 |
| Jordan | 2 | 2 | 0 | 165 |
| Qatar | 1 | 0 | 1 | 537 |
| Spain | 2 | 2 | 0 | 171 |
| Kuwait | 1 | 1 | 0 | 41 |
| Egypt | 2 | 1 | 1 | 293 |
| Portugal | 1 | 1 | 0 | 104 |
| Thailand | 3 | 2 | 1 | 112 |
| El Salvador | 1 | 1 | 0 | 147 |
| China | 3 | 3 | 0 | 160 |
| Trinidad & Tobago | 1 | 1 | 0 | 130 |
| Mozambique | 2 | 0 | 2 | 158 |
| Moldova | 1 | 1 | 0 | 232 |
| Italy | 1 | 1 | 0 | 234 |
| United Arab Emirates | 1 | 1 | 0 | 608 |
| Bosnia-Herzegovina | 1 | 0 | 1 | 194 |
| Hungary | 1 | 0 | 1 | 93 |
| Croatia | 1 | 1 | 0 | 90 |
| Ireland | 1 | 1 | 0 | 134 |
Status By Consulate, Visa Type (statistics for last 360 days)
| Consulate | Total Records | Num of Pending Applications | Num with Final Visa Approval | Avg. Days btw NOA2 and Interview |
|---|---|---|---|---|
| Manila, Philippines | 19 | 12 | 7 | 273 |
| Montreal, Canada | 34 | 16 | 18 | 225 |
| Frankfurt, Germany | 7 | 3 | 4 | 132 |
| Bogota, Colombia | 12 | 6 | 6 | 147 |
| Bahrain | 2 | 1 | 1 | 280 |
| Dominican Republic | 12 | 8 | 4 | 332 |
| Malaysia | 2 | 0 | 2 | 110 |
| Juarez, Mexico | 16 | 9 | 7 | 764 |
| Tokyo, Japan | 7 | 1 | 6 | 131 |
| Ghana | 10 | 3 | 7 | 684 |
| Bucharest, Romania | 3 | 2 | 1 | 149 |
| Mumbai, India | 23 | 12 | 11 | 321 |
| Bulgaria | 1 | 0 | 1 | 167 |
| Liberia | 1 | 0 | 1 | 762 |
| London, United Kingdom | 29 | 17 | 12 | 143 |
| Cambodia | 1 | 0 | 1 | 328 |
| Armenia | 22 | 14 | 8 | 401 |
| Bangladesh | 3 | 3 | 0 | 376 |
| Senegal | 3 | 2 | 1 | 327 |
| Lebanon | 3 | 2 | 1 | 284 |
| Peru | 3 | 1 | 2 | 162 |
| Ho Chi Minh City, Vietnam | 3 | 0 | 3 | 104 |
| Rio de Janeiro, Brazil | 5 | 1 | 4 | 194 |
| Kenya | 4 | 3 | 1 | 700 |
| Islamabad, Pakistan | 11 | 7 | 4 | 722 |
| Mexico City, Mexico | 1 | 0 | 1 | 630 |
| Nigeria | 15 | 8 | 7 | 551 |
| Jamaica | 4 | 2 | 2 | 198 |
| Honduras | 6 | 4 | 2 | 511 |
| Costa Rica | 3 | 2 | 1 | 194 |
| Consulate | Total Records | Num of Pending Applications | Num with Final Visa Approval | Avg. Days btw NOA2 and Interview |
| Ankara, Turkey | 6 | 4 | 2 | 263 |
| Argentina | 2 | 1 | 1 | 167 |
| Amsterdam, Netherlands | 4 | 1 | 3 | 142 |
| Jordan | 1 | 1 | 0 | 183 |
| Sweden | 2 | 1 | 1 | 129 |
| Sydney, Australia | 4 | 3 | 1 | 180 |
| Morocco | 8 | 5 | 3 | 309 |
| Seoul | 4 | 1 | 3 | 162 |
| C�te D'Ivoire | 1 | 0 | 1 | 235 |
| Belgium | 5 | 3 | 2 | 132 |
| Zambia | 1 | 0 | 1 | 346 |
| Tunisia | 4 | 4 | 0 | 153 |
| Auckland, New Zealand | 2 | 2 | 0 | 152 |
| New Delhi, India | 1 | 0 | 1 | 315 |
| Guayaquil, Ecuador | 2 | 1 | 1 | 170 |
| Slovakia | 1 | 1 | 0 | 118 |
| Warsaw, Poland | 4 | 2 | 2 | 173 |
| Taipei, Taiwan | 1 | 0 | 1 | 231 |
| Indonesia | 1 | 0 | 1 | 131 |
| France | 5 | 3 | 2 | 127 |
| Yemen | 1 | 0 | 1 | 260 |
| Singapore | 2 | 1 | 1 | 138 |
| Guyana | 2 | 0 | 2 | 124 |
| Hong Kong, China | 1 | 0 | 1 | 220 |
| Cameroon | 1 | 0 | 1 | 201 |
| Barbados | 1 | 1 | 0 | 146 |
| Chile | 3 | 0 | 3 | 162 |
| Naples, Italy | 2 | 1 | 1 | 193 |
| Finland | 1 | 1 | 0 | 75 |
| Bolivia | 1 | 1 | 0 | 205 |
| Consulate | Total Records | Num of Pending Applications | Num with Final Visa Approval | Avg. Days btw NOA2 and Interview |
| Haiti | 2 | 2 | 0 | 741 |
| Ethiopia | 1 | 1 | 0 | 793 |
| Amman, Jordan | 2 | 2 | 0 | 165 |
| Qatar | 1 | 0 | 1 | 537 |
| Madrid, Spain | 3 | 3 | 0 | 138 |
| Kazakhstan | 1 | 0 | 1 | 256 |
| Kuwait | 1 | 1 | 0 | 41 |
| Egypt | 2 | 1 | 1 | 293 |
| Bangkok, Thailand | 3 | 2 | 1 | 112 |
| El Salvador | 1 | 1 | 0 | 147 |
| Trinidad & Tobago | 1 | 1 | 0 | 130 |
| Israel | 2 | 2 | 0 | 202 |
| South Africa | 1 | 0 | 1 | 219 |
| Moldova | 1 | 1 | 0 | 232 |
| Moscow, Russia | 1 | 1 | 0 | 221 |
| Brasilia, Brazil | 1 | 1 | 0 | 245 |
| United Arab Emirates | 1 | 1 | 0 | 608 |
| Bosnia-Herzegovina | 1 | 0 | 1 | 194 |
| Hungary | 1 | 0 | 1 | 93 |
| Croatia | 1 | 1 | 0 | 90 |
| Mozambique | 1 | 0 | 1 | 97 |
| Guangzhou, China | 1 | 1 | 0 | 154 |
| Dublin, Ireland | 1 | 1 | 0 | 134 |
Pending - Visa not yet received/ not in hand
Timelines
 ver 5.0