
AOS Timelines Statistics
The Statistics Below reflect all applications in the databaseSelect the History Period: [ ALL Time ] [ Last Year ] [ Last 6 months ] [ Last 3 months ]
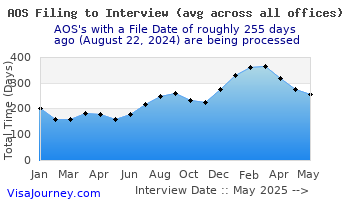
Overall AOS Statistics (for the last 3600 days)
| Total Records | Avg. Total Days to Interview | Avg. Days to 1st NOA | Avg. Days btw 1st NOA Biometrics | Avg. Days btw Biometrics and Interview (if interview required) | Avg. Days btw Biometrics and Decision Date | Avg. Days btw Decision Date and Receiving Green Card |
|---|---|---|---|---|---|---|
| 5524 | 256 | 9 | 39 | 207 | 220 | 9 |
Statistics by AOS Office (for the last 3600 days)
| AOS Office | Total Records | Avg. Total Days to Interview | Avg. Days to 1st NOA | Avg. Days btw 1st NOA Biometrics | Avg. Days btw Biometrics and Interview (if interview required) | Avg. Days btw Biometrics and Decision Date | Avg. Days btw Decision Date and Receiving Green Card |
|---|---|---|---|---|---|---|---|
| Houston TX | 114 | 396 | 9 | 44 | 345 | 364 | 16 |
| Detroit MI | 184 | 188 | 9 | 36 | 140 | 148 | 11 |
| San Diego CA | 114 | 228 | 9 | 36 | 180 | 188 | 26 |
| Reno NV | 18 | 168 | 8 | 32 | 124 | 154 | -60 |
| Orlando FL | 73 | 301 | 11 | 44 | 244 | 253 | 16 |
| New York City NY | 200 | 350 | 9 | 39 | 303 | 326 | 16 |
| Atlanta GA | 116 | 289 | 11 | 43 | 232 | 250 | 16 |
| Saint Paul MN | 85 | 364 | 9 | 35 | 319 | 349 | -56 |
| Albany NY | 25 | 248 | 9 | 31 | 223 | 245 | 6 |
| Jacksonville FL | 42 | 208 | 9 | 42 | 148 | 177 | 27 |
| San Bernadino CA | 91 | 195 | 10 | 35 | 153 | 159 | 10 |
| San Francisco CA | 195 | 309 | 9 | 36 | 266 | 277 | 13 |
| Seattle WA | 233 | 390 | 9 | 29 | 349 | 361 | 12 |
| Chula Vista CA | 26 | 193 | 10 | 30 | 151 | 152 | 10 |
| Chicago IL | 352 | 244 | 10 | 36 | 198 | 211 | 11 |
| San Antonio TX | 87 | 247 | 10 | 43 | 191 | 188 | 9 |
| West Palm Beach FL | 26 | 256 | 9 | 46 | 206 | 208 | 55 |
| Santa Ana CA | 73 | 272 | 8 | 28 | 232 | 247 | 7 |
| Miami FL | 46 | 327 | 9 | 42 | 278 | 274 | 9 |
| Hialeah FL | 13 | 254 | 9 | 26 | 201 | 226 | 7 |
| Los Angeles CA | 279 | 230 | 10 | 33 | 187 | 195 | 11 |
| Saint Louis MO | 55 | 205 | 10 | 61 | 134 | 165 | 20 |
| Nashville TN | 32 | 278 | 9 | 76 | 194 | 195 | 9 |
| Pittsburgh PA | 42 | 179 | 9 | 45 | 124 | 141 | 10 |
| Charleston SC | 38 | 173 | 9 | 39 | 125 | 131 | 9 |
| Boston MA | 140 | 200 | 10 | 43 | 145 | 149 | 9 |
| Charlotte NC | 71 | 252 | 11 | 41 | 188 | 224 | 8 |
| Portland OR | 135 | 220 | 9 | 45 | 168 | 178 | 12 |
| Cleveland OH | 69 | 163 | 8 | 48 | 106 | 115 | 9 |
| Baltimore MD | 112 | 285 | 9 | 36 | 233 | 267 | 3 |
| AOS Office | Total Records | Avg. Total Days to Interview | Avg. Days to 1st NOA | Avg. Days btw 1st NOA Biometrics | Avg. Days btw Biometrics and Interview (if interview required) | Avg. Days btw Biometrics and Decision Date | Avg. Days btw Decision Date and Receiving Green Card |
| Oklahoma City OK | 40 | 184 | 11 | 25 | 148 | 154 | 9 |
| Dallas TX | 146 | 370 | 9 | 40 | 321 | 337 | 2 |
| Indianapolis IN | 56 | 206 | 9 | 76 | 123 | 161 | 19 |
| El Paso TX | 17 | 151 | 7 | 37 | 105 | 116 | 7 |
| Milwaukee WI | 63 | 247 | 10 | 57 | 182 | 186 | 11 |
| Boise ID | 18 | 209 | 10 | 25 | 183 | 175 | 11 |
| Fort Smith AR | 17 | 257 | 10 | 39 | 208 | 225 | 65 |
| Yakima WA | 23 | 170 | 11 | 33 | 126 | 128 | 9 |
| Sacramento CA | 98 | 249 | 8 | 23 | 226 | 225 | 16 |
| Honolulu HI | 81 | 193 | 11 | 42 | 139 | 150 | 9 |
| Denver CO | 152 | 261 | 9 | 39 | 211 | 224 | 8 |
| Phoenix AZ | 120 | 248 | 9 | 41 | 195 | 195 | 18 |
| Oakland Park FL | 27 | 305 | 10 | 35 | 262 | 260 | 8 |
| Des Moines IA | 29 | 259 | 11 | 45 | 201 | 218 | 27 |
| Tucson AZ | 39 | 136 | 10 | 33 | 91 | 104 | 8 |
| Rochester NY | 2 | 287 | 8 | 25 | 254 | 266 | 6 |
| Tampa FL | 71 | 235 | 8 | 40 | 186 | 196 | 8 |
| Memphis TN | 42 | 221 | 10 | 32 | 180 | 191 | 16 |
| Albuquerque NM | 16 | 178 | 10 | 30 | 132 | 144 | 9 |
| Columbus OH | 42 | 176 | 10 | 44 | 121 | 141 | 8 |
| Mount Laurel NJ | 33 | 207 | 9 | 47 | 153 | 207 | 6 |
| Cincinnati OH | 42 | 180 | 10 | 49 | 120 | 124 | 11 |
| Newark NJ | 73 | 342 | 9 | 38 | 296 | 307 | 7 |
| San Jose CA | 121 | 257 | 8 | 38 | 209 | 235 | 3 |
| Casper WY | 5 | 173 | 9 | 32 | 160 | 196 | 7 |
| Omaha NE | 36 | 184 | 8 | 30 | 149 | 188 | 7 |
| Philadelphia PA | 126 | 273 | 9 | 36 | 228 | 250 | 10 |
| Manchester NH | 16 | 193 | 10 | 34 | 149 | 140 | 7 |
| Hartford CT | 58 | 285 | 10 | 45 | 237 | 260 | 7 |
| Las Vegas NV | 78 | 271 | 9 | 36 | 233 | 263 | -8 |
| AOS Office | Total Records | Avg. Total Days to Interview | Avg. Days to 1st NOA | Avg. Days btw 1st NOA Biometrics | Avg. Days btw Biometrics and Interview (if interview required) | Avg. Days btw Biometrics and Decision Date | Avg. Days btw Decision Date and Receiving Green Card |
| Washington DC | 98 | 317 | 9 | 42 | 268 | 282 | 8 |
| Fresno CA | 35 | 200 | 9 | 30 | 163 | 164 | 9 |
| Agana GU | 21 | 150 | 10 | 39 | 102 | 105 | 10 |
| New Orleans LA | 33 | 273 | 9 | 60 | 207 | 232 | 7 |
| Anchorage AK | 20 | 151 | 8 | 39 | 97 | 116 | 12 |
| Buffalo NY | 30 | 208 | 10 | 47 | 152 | 165 | 10 |
| Kansas City MO | 80 | 192 | 11 | 56 | 119 | 127 | -17 |
| Harlingen TX | 12 | 120 | 6 | 22 | 94 | 102 | 7 |
| Louisville KY | 50 | 185 | 11 | 31 | 145 | 166 | 13 |
| Portland ME | 17 | 165 | 9 | 47 | 111 | 120 | 7 |
| Imperial CA | 5 | 185 | 10 | 35 | 140 | 140 | 7 |
| Spokane WA | 37 | 152 | 11 | 37 | 104 | 105 | 19 |
| Salt Lake City UT | 48 | 329 | 10 | 51 | 241 | 275 | 7 |
| Norfolk VA | 47 | 225 | 10 | 30 | 187 | 201 | 9 |
| Syracuse NY | 8 | 207 | 9 | 30 | 169 | 184 | 8 |
| Saint Albans VT | 17 | 155 | 9 | 27 | 119 | 125 | 6 |
| Charlotte Amalie VI | 1 | 110 | 4 | 22 | 84 | 84 | 8 |
| Greer SC | 15 | 152 | 10 | 43 | 97 | 106 | 10 |
| Charleston WV | 6 | 159 | 7 | 40 | 111 | 96 | 31 |
| Helena MT | 17 | 179 | 9 | 25 | 140 | 172 | 7 |
| Raleigh NC | 68 | 166 | 9 | 39 | 119 | 119 | 7 |
| Dover DE | 2 | 265 | 18 | 22 | 225 | ||
| Cherry Hill NJ | 3 | 189 | 12 | 20 | 149 | 166 | 6 |
| Kendall FL | 11 | 234 | 8 | 29 | 196 | 222 | 7 |
| Wichita KS | 13 | 233 | 11 | 36 | 188 | 200 | 5 |
| Providence RI | 11 | 213 | 11 | 35 | 143 | 141 | 13 |
| Montgomery AL | 40 | 277 | 11 | 42 | 221 | 219 | 9 |
| San Juan PR | 5 | 145 | 9 | 40 | 96 | 104 | 8 |
| Montgomery | 1 | 381 | 3 | 24 | 354 | 354 | 7 |
Back to Timelines
 ver 5.0