
AOS Timelines Statistics
The Statistics Below reflect applications filed within the last 360 days.Select the History Period: [ ALL Time ] [ Last Year ] [ Last 6 months ] [ Last 3 months ]
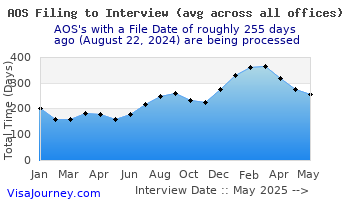
Overall AOS Statistics (for the last 360 days)
| Total Records | Avg. Total Days to Interview | Avg. Days to 1st NOA | Avg. Days btw 1st NOA Biometrics | Avg. Days btw Biometrics and Interview (if interview required) | Avg. Days btw Biometrics and Decision Date | Avg. Days btw Decision Date and Receiving Green Card |
|---|---|---|---|---|---|---|
| 28 | 238 | 7 | 30 | 207 | 215 | 11 |
Statistics by AOS Office (for the last 360 days)
| AOS Office | Total Records | Avg. Total Days to Interview | Avg. Days to 1st NOA | Avg. Days btw 1st NOA Biometrics | Avg. Days btw Biometrics and Interview (if interview required) | Avg. Days btw Biometrics and Decision Date | Avg. Days btw Decision Date and Receiving Green Card |
|---|---|---|---|---|---|---|---|
| San Diego CA | 1 | 215 | 8 | 26 | 181 | 182 | 19 |
| Chicago IL | 2 | 321 | 11 | 27 | 283 | 285 | 7 |
| Sacramento CA | 2 | 392 | 4 | 33 | 355 | 99 | |
| Denver CO | 2 | 220 | 4 | 28 | 189 | 169 | 8 |
| Las Vegas NV | 2 | 364 | 3 | 29 | 332 | 333 | |
| Houston TX | 4 | 163 | 10 | 28 | 124 | 188 | 11 |
| Los Angeles CA | 1 | 124 | 4 | 22 | 98 | 98 | |
| Tampa FL | 1 | 519 | 2 | 41 | 476 | 476 | |
| Washington DC | 2 | 229 | 3 | 24 | 155 | 316 | 7 |
| Phoenix AZ | 1 | 199 | 2 | 29 | 168 | 169 | |
| Charlotte NC | 1 | 51 | 27 | ||||
| Miami FL | 1 | 318 | 10 | 25 | 283 | 283 | |
| Seattle WA | 3 | 124 | 8 | 23 | 93 | 97 | 13 |
| Montgomery AL | 1 | 139 | 1 | 26 | 112 | 112 | 12 |
| El Paso TX | 1 | 213 | |||||
| Providence RI | 1 | 239 | 19 | 79 | 141 | ||
| Jacksonville FL | 1 | 529 | 0 | 30 | 499 | 500 | |
| Salt Lake City UT | 1 | 49 | 7 | 28 | 14 | 14 | 14 |
Back to Timelines
 ver 5.0